![]()
Application Examples
This section presents five common oscilloscope applications:
1. Taking simple measurements
2. Analyzing signal detail
3. Triggering on a video signal
4. Capturing a single-shot signal
5. Using the disk drive
Each application example highlights different features of the oscilloscope and gives you ideas about using the oscilloscope to solve test problems.
Taking Simple
Measurements
You need to see a signal in a circuit, but you do not
know the signal amplitude or frequency. Connect the oscilloscope
to quickly display the signal and then measure its frequency and
peak-to-peak amplitude.
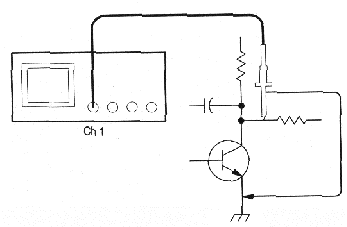
Using Autoset
To quickly display a signal, do these steps:
1. Connect the channel 1 probe to the signal.
2. Push the AUTOSET button.
The oscilloscope sets vertical, horizontal, and trigger controls automatically. You can manually adjust any of these controls if you need to optimize the display of the waveform.
**NOTE**When you are using more than one channel, the AUTOSET function sets the vertical controls for each channel and uses the lowest-numbered active channel to set the horizontal and trigger controls.
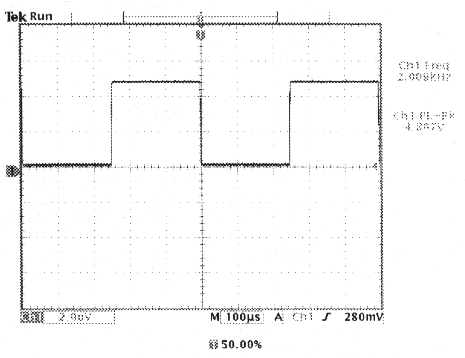
Selecting Automatic Measurements
The oscilloscope can take automatic measurements of most displayed
signals. To measure signal frequency and peak-to-peak amplitude,
do these steps:
1. Push the MEASURE button to see the measurement
menu.
2. Push the CH1 button and then push the Select
Measurement for CH1 screen button
3. Select the Frequency measurement.
4. Push the more screen button until you can select
the Pk-Pk measurement.
5. Push the MENU OFF button.
The measurements show on the screen and update as the signal changes.
![]()
Measuring Two Signals
You are testing a piece of equipment and need to measure the
gain of its audio amplifier. You have an audio generator that
can inject a test signal at the amplifier input, Connect two oscilloscope
channels to the amplifier input and output as shown. Measure both
signal levels and use these measurements to calculate the gain.
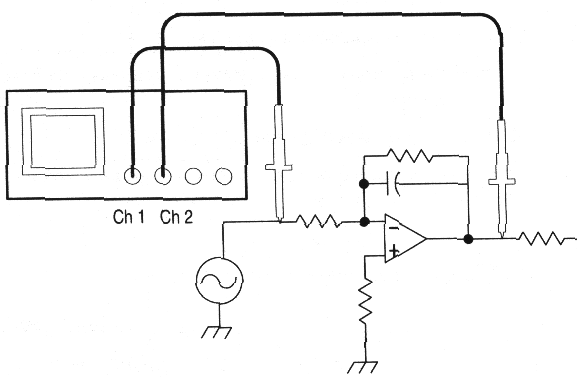
To display the signals connected to channels 1 and 2, do these steps:
1. Push the CH1 and CH2 buttons to activate
both channels.
2. Push the AUTOSET button.
To select measurements for the two channels, do these steps:
1. Push the MEASURE button to see the measurement
menu.
2. Push the CH1 button and then push the Select
Measurement for CH1 screen button.
3. Select the Amplitude measurement.
4. Push the CH2 button and then push the Select
Measurement for Ch2 screen button.
5. Select the Amplitude measurement.
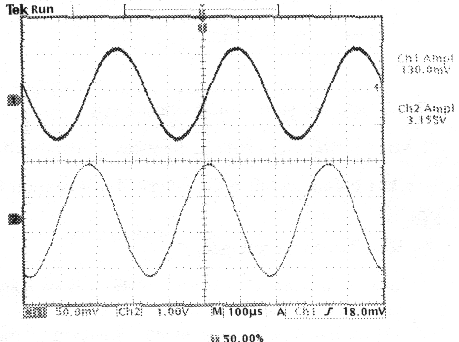
6. Calculate the amplifier gain using the following equations:

Gain (dB) - 20 x log (24.27) = 27.7 dB
![]()
Customizing Your Measurements
In this example you want to verify that the incoming signal
to a piece of digital equipment meets its specifications. Specifically,
the transition time from a low logic level (0.8 V) to a high logic
(2.0 V) must be 10ns or less.
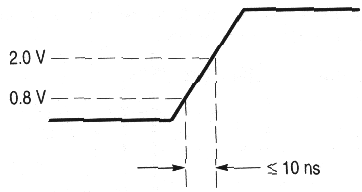
To select the rise time measurement, do these steps:
1. Push the MEASURE button to see the measurement
menu.
2. Push the CH1 button and then the Select Measurement
for CH1 screen button.
3. Select the Rise Time measurement.
Rise time is typically measured between the 10% and 90% amplitude levels of a signal; these are the default reference levels the oscilloscope uses for rise time measurements, However, in this example you need to measure the time the signal takes to pass between the 0.8 V and 2.0 V levels.
You can customize the rise time measurement to measure the signal transition time between any two reference levels. You can set each of those reference levels to a specific percent of the signal amplitude or to a specific level in vertical units (such as volts or amperes).
Setting Reference Levels.
To set the reference levels to specific voltages, do these
steps:
1. Push the Reference Levels screen button.
2. Push the Set Levels in screen button to select
units.
3. Push the High Ref screen button.
4. Use the general-purpose knob to select 2.0V.
5. Push the Low Ref screen button.
6. Use the general purpose knob to select 800mV
The measurement verifies that the transition time (3.842ns) meets the specification (<= 10ns).
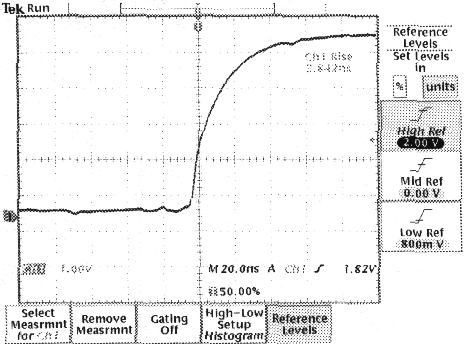
Measuring Specific Events.
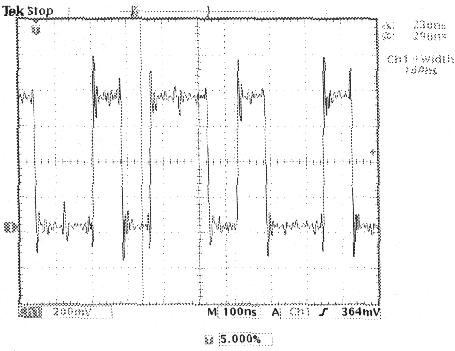
Next you want to see the pulses in the incoming digital signal,
but the pulse widths vary so it is hard to establish a stable
trigger. To took at a snapshot of the digital signal, do this
step:
1. Push the SINGLE SEQ button to capture a single acquisition.
Now you want to measure the width of each displayed pulse. You can use measurement gating to select a specific pulse to measure. To measure the second pulse, for example, do these steps:
1. Push the MEASURE button.
2. Push the CH1 button and then push the Select
Measurement for CH1 screen button.
3. Select the Positive Width measurement.
4. Push the Gating screen button.
5. Select Gate with V Bar Cursors to choose measurement
gating using cursors.
6. Place one cursor to the left and one cursor to the right
of the second pulse.
The oscilloscope shows (he width measurement (160ns) for the second pulse.
Analyzing Signal
Detail
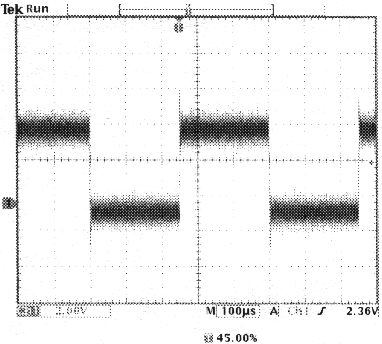
You have a noisy signal displayed on the oscilloscope
and you need to know more about it. You suspect that the signal
contains much more detail than you can now see in the display.
Looking at a Noisy
Signal
The signal appears noisy and you suspect that noise is causing
problems in your circuit. To better analyze the noise, do these
steps.
1. Push the acquire MENU button.
2. Select the Peak Detect acquisition mode.
3. Increase the WAVEFORM INTENSITY control to see
the noise more easily.
Peak detect emphasizes noise spikes and glitches in your signal
as narrow as 1ns, even when the time base is set to a slow setting.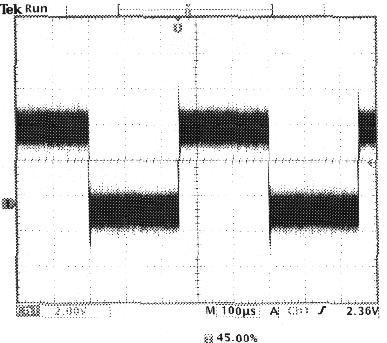
Refer to LINK for more information about peak-detect and the other acquisition modes.
![]()
Separating the
Signal from Noise
Now you want to analyze the signal shape and ignore the noise.
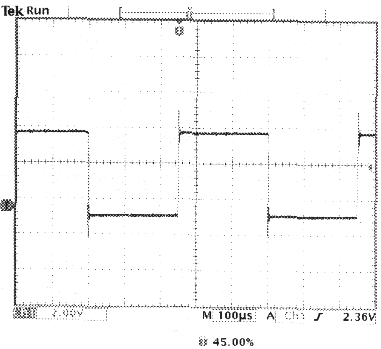
To reduce random noise in the oscilloscope display, do these steps:
1. Push the acquire MENU button,
2. Select the Average acquisition mode.
Averaging reduces random noise and makes it easier to see detail in a signal. In the example below. a ring shows on the rising and failing edges of the signal when the noise is removed.
Taking Cursor
Measurements
You can use the cursors to take quick measurements on a waveform.
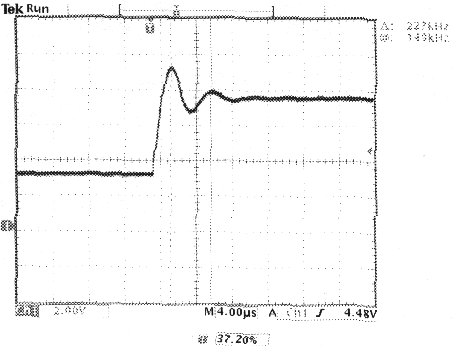
To measure the ring frequency at the rising edge of the signal,
do these steps:
1. Push the CURSOR button.
2. Push the Function screen button.
3. Select V Bars cursors.
4. Push the Time Units screen button.
5. Select 1/seconds (Hz).
6. Place one cursor on the first peak of the ring using the
general-purpose knob.
7. Push the SELECT button.
8. Place the other cursor on the next peak of the ring.
The cursor readout shows the measured ring frequency is 227 kHz
Using Delay
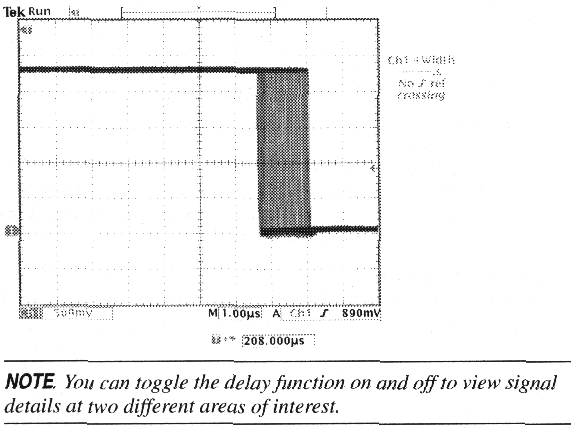
You are analyzing a pulse waveform and use the + Width measurement
to measure the waveform pulse width. You notice that the measurement
is not stable, which implies that there is jitter in the pulse
width.
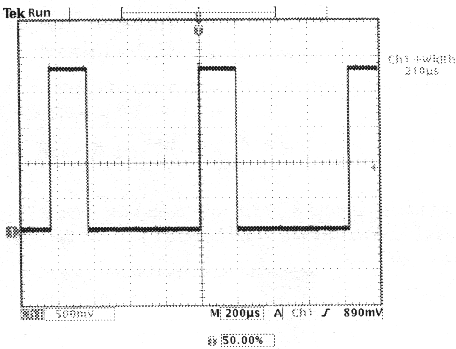
To use delay to see the jitter, do these steps:
1. Push the DELAY button.
2. Adjust the horizontal POSITION control to set
the delay close to the nominal pulse width (210us). Push the COARSE
button to make delay adjustments more quickly, Push COARSE
again to fine tune the delay time.
The falling edge of the pulse is now, near the center of the screen. When delay is on, the horizontal expansion point separates from the trigger point and remains in the center of the screen.
3. Adjust the horizontal SCALE to a faster time base setting and increase the WAVEFORM INTENSITY to see the jitter in the pulse width.
![]()
Measuring Jitter
To measure the peak-to-peak jitter, do these steps:
1. Push the CURSOR button.
2. Push the Function screen button.
3. Select the V Bars cursors.
4. Push the Bring Both Cursors On Screen button
to quickly locate the cursors.
5. Place one cursor at the first falling edge and place
the other cursor at the last failing edge.
6. Read the peak-to-peak jitter in the D readout (1.40us).
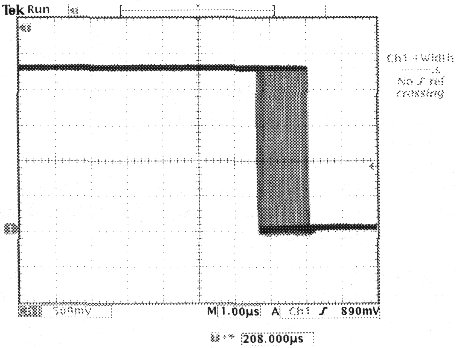
You can also measure the minimum and maximum pulse widths. When you select the first cursor, the @ readout displays the minimum pulse width (210us). When you select the second cursor, the @ readout displays the maximum pulse width (211us).
Triggering on
a Video Signal
You are testing the video circuit in apiece of medical equipment
and need to display the video output signal. The video output
is an NTSC standard signal. Use the video trigger to obtain a
stable display.
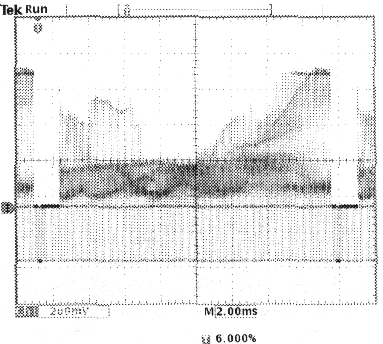
To trigger on the Video fields, do these steps:
1. Push the trigger MENU button,
2. Push the Type screen button to select Video.
3. Push the Standard semen button to select 525/NTSC.
4. Push the Trigger On screen button.
5. Select Odd.
6. Adjust the horizontal SCALE to see a complete field
across the screen.
7. Push the acquire MENU button.
8. Push the Resolution screen button.
9. Select Normal acquisition resolution.
Normal acquisition resolution is the best choice to acquire a video field signal because the signal contains a great amount of horizontal detail.
If the signal had been non interlaced, you could choose to trigger on All Fields.
![]()
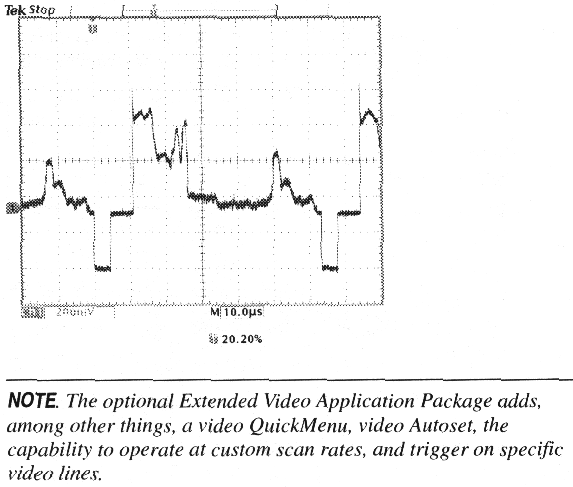
Triggering on Lines.
You can also look at the video lines in the field.
To trigger on the lines, do these steps:
1. Push the Trigger On screen button.
2. Select All Lines.
3. Adjust the horizontal SCALE to see a complete video
line across the screen.
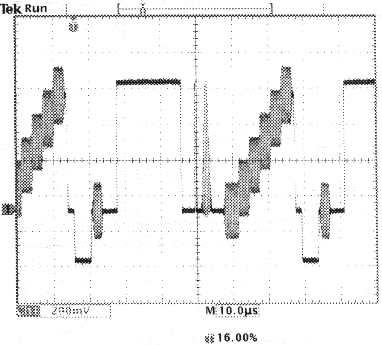
Looking at Modulation.
A dedicated video waveform monitor clearly shows the modulation
in a video signal. To see a similar modulation display an the
oscilloscope screen, do these steps:
1. Start with triggered display of the video lines.
2. Push the acquire MENU button.
3. Push the Resolution screen button.
4. Select Fast Trigger acquisition resolution.
5. Adjust the WAVEFORM INTENSITY control for the
correct amount of modulation.
The oscilloscope now shows signal modulation in shades of intensity and appears similar to the display of a video waveform monitor or an analog oscilloscope. Fast trigger acquisition resolution is the best choice to acquire a video line signal with a rapidly changing shape.
Capturing a Single-Shot
Signal
The reliability of a reed relay in a piece of equipment has been
poor and you need to investigate the problem. You suspect that
the relay contacts we when the relay opens. The fastest you can
open and close the relay is about once per minute so you need
to capture the voltage across the relay as a single-shot acquisition.
To set up for a single-shot acquisition, do these steps:
1. Adjust the vertical SCALE and horizontal SCALE
to appropriate ranges for the signal you expect to see.
2. Push the acquire MENU button.
3. Push the Resolution screen button.
4. Select Normal acquisition resolution.
5. Push the SINGLE SEQ (single sequence) button.
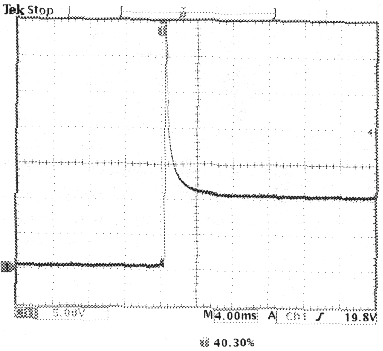
The SINGLE SEQ button sets trigger parameters to the correct settings for a single-shot acquisition.
Optimizing the
Acquisition
The initial acquisition shows the relay contact beginning to open
at the trigger point. This is followed by large spikes that indicate
contact bounce and inductance in the circuit. The inductance can
cause contact arcing and premature relay failure.
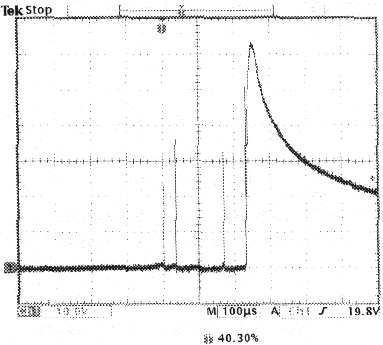
Before you take the next acquisition, you can adjust the vertical and horizontal controls to give you a preview of how the next acquisition might appear. As you adjust these controls, the current acquisition is repositioned, expanded, or compressed. This preview is useful to optimize the settings before the next single-shot event is captured.
When next acquisition is captured with the new vertical and horizontal settings, you can see more detail about the relay contact opening. You can now see that the contact bounces several times as it opens.
![]()
Using the Horizontal Zoom Function
If you want to take a close look at a particular spot on the acquired
waveform, use the horizontal zoom function. To look closely at
the point where the relay contact first begins to open, do these
steps.
1. Push the zoom button![]()
2. Use the horizontal POSITION to place the expansion
point close to where the relay contact begins to open.
3. Adjust the horizontal SCALE to magnify the waveform
around the expansion point.
The ragged waveform and the inductive load in the circuit suggest that the relay contact may be arcing as it opens.
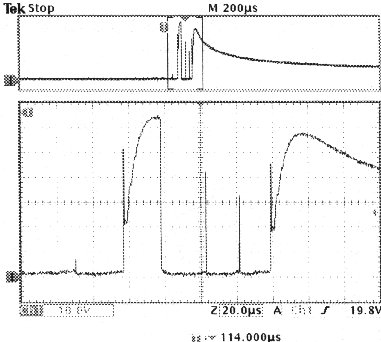
The zoom function works equally well when acquisition is running or is stopped. Horizontal position and scale changes affect only the display, not the next acquisition.
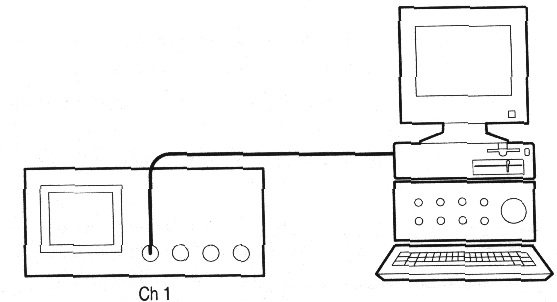
Using the Disk
Drive
You need to do some work inside a remote site. You expect to use
the oscilloscope to look at signal waveforms and then bring waveform
information back to the office to complete a report and perform
additional analysis. To do this, take along an IBM-compatible
floppy disk.
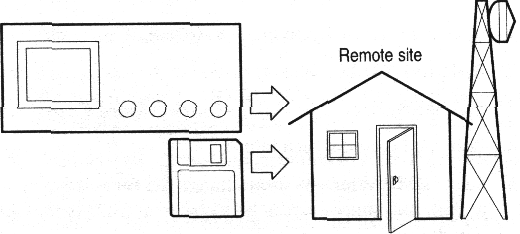
When you need to capture screen images, it may be most convenient
to first save them to disk. Once on the disk. you can load the
screen images into a PC, print hard copies with a printer attached
to the oscilloscope or your PC, or import the screen images into
desktop publishing software to produce a report.
You can also save waveform data on the disk, From the disk, you can recall waveforms to the oscilloscope display or you can import the data into spreadsheet and Mathcad software to perform additional analysis.
If you have oscilloscope setups that you want to use again, you also can store them on the disk. See Save/Recall at LINK for more information on this capability. For information about remote control of the oscilloscope and network printing, see the AD007 and WSTRO accessories on page C-4 (user manual).
Saving Screen
images
While working at the remote site you discover a control signal
that you want to capture periodically to show its long-term variation.
You want to include these waveforms in a report you are preparing
back at the office.
Your desktop publishing software can import BMP graphics, so you decide to use this format for the screen images. To setup this configuration, do these steps:
1. Insert a floppy disk into the disk drive.
2. Push the UTILITY button.
3. Push the System screen button to select Hard Copy.
4. Push the Format screen button.
5. Select BMP Windows mono image file format (you
may need to push the -more- screen button several times before
you see this choice).
6. Push the Port screen button.
7. Select File to send hard copies to disk. Optimizing
the Acquisition
The oscilloscope reads the disk directory and displays its contents
Naming Files.
It is good practice to give disk files descriptive names so you
can recognize them whet you get back to the office. You will be
saving images of the control signal so you decide CNTRL is a logical
target file name to use.
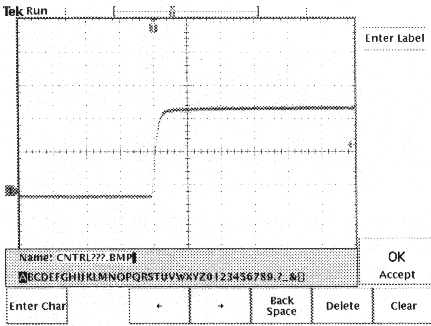
The oscilloscope can append an automatic sequence number to the target file name. This feature is convenient because you want to capture a screen image of the same control signal every five minutes. To set up the target file name and automatic sequence, do these steps:
1. Push the File Utilities screen button.
2. Use the general-purpose knob to highlight the file TEK?????.BMP.
3. Select the Rename screen button.
4. Use the screen buttons to clear the existing file name
and enter the new file name CNTRL???.BMP. The question
marks are place holders for an automatic number sequence from
000 to 999.
5. Push the OK Accept screen button to setup the
target base File name.
6. Push MENU OFF to remove the file list from the
display.
Running the Test.
To capture the control signal every few minutes, do these steps:
1. Display the signal, measurements, and menus as you
want them to appear in the screen images.
2. Push the hardcopy button.![]()
3. Repeat step 2 every few minutes until you are finished
with the test.
4. When you are finished, push UTILITY to see the
list of sequential files that have been saved.
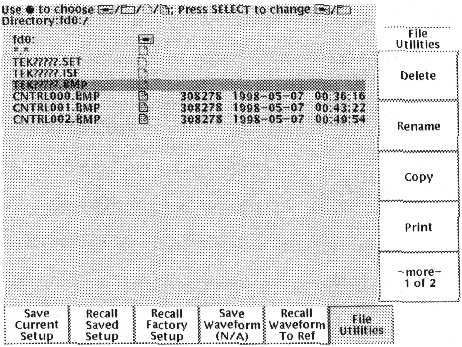
The files are labeled with their sequential names as well as the time and date each was created. You can save up to four BMP images or approximately 35 TIFF images on a single 1.44 MB floppy disk.
Saving Waveform
Data
You find another signal that you want to analyze with a spreadsheet
program back at the office. To save the waveform dam on a disk,
do these steps:
1. Display the signal on the Oscilloscope Screen.
2. Push the SAVE/RECALL button.
3. Push the Save Wfm screen button.
4. Select To File.
5. Select Spreadsheet File Format. The default target
file, TEK?????.CSV, is now automatically highlighted.
6. Push the Save To Selected File screen button
to save the waveform.
7. Push the File Utilities screen button to see
the saved waveform file TEK00000.CSV in the disk directory.

![]()